How Claude’s File Creation Feature Is Transforming Excel Analysis

From spreadsheet chaos to something you can trust.
You know the feeling: eighteen tabs, four hundred columns, and a tiny knot in your stomach. You scroll. You filter. You hope the pivot wasn’t off by one cell. Here’s the thing—
Claude can now do real work on that mess. Not a cute demo. Real work.
What “real work” actually looks like
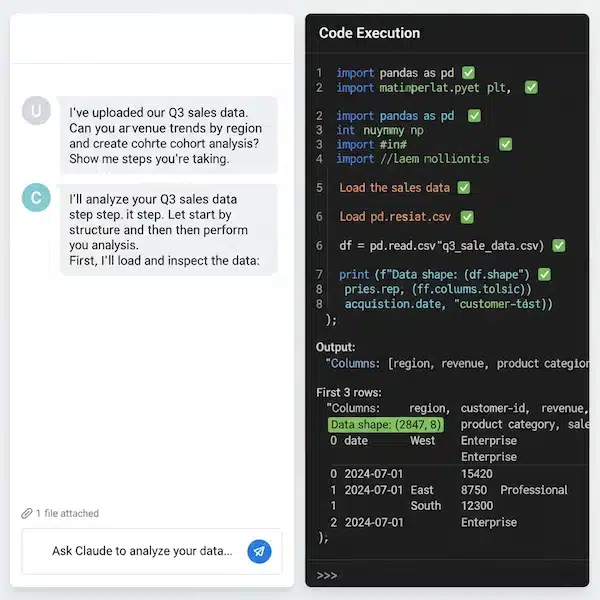
When you need precise, checkable answers, Claude behaves more like a careful analyst than a chatty assistant.
It doesn’t stop at a paragraph of commentary. It runs a process—clean, join, test, chart, export—until there’s a result you can open and verify.
In practice, that means it can:
- Clean gnarly columns (dates, currencies, stray whitespace) and record the steps it took.
-
Join sheets, build pivots, compute cohorts, and hand you a tidy table.
-
Generate reusable charts—line, bar, small multiples—and export images. With web libraries in the loop, you can even get polished, shareable visuals.
- Validate assumptions: flag outliers, duplicated keys, missing joins, rounding drift.
-
Save a script so next month isn’t Groundhog Day.

What’s under the hood
There are two pieces you’ll actually care about:
-
The analysis tool in Claude.ai, which runs JavaScript inside the chat.
-
The upgraded file creation and analysis feature, which runs Python and Node.js in a sandbox.
Together, they turn CSVs and spreadsheets into artifacts you can keep—tables, charts, reports—without babysitting every cell.
Pick your lane: click or code
If you want click-and-drag in the browser
The file creation feature is currently available for Max, Team, and Enterprise plan users, with Pro users getting access in the coming weeks.
Drag in a CSV or workbook. Ask for an analysis plan—not just an answer. Have Claude show intermediate tables and justify each step. You’ll get outputs that are mathematically precise and reproducible right in the chat, including visualizations.
Note: files need to fit the chat’s context window for the analysis tool. The upgraded file creation feature handles work differently with server-side processing.
If you live in the terminal
With the API and CLI, Claude Code runs code and bash in a secure sandbox: create/edit files, read data, render charts, and return artifacts. Perfect for recurring jobs or teams that want versioned outputs.
Prefer a terminal-first workflow? Use the Claude Code CLI/SDK to script tasks from your project directory, right next to your data files. It meets you where you already work with the tools you already like. It’s intentionally low‑level and unopinionated—close to raw model access without forcing a specific style—so you get a flexible, scriptable, safe power tool.
Make it trustworthy (and fast)
Claude’s first attempt improves a lot with clear instructions. Be specific early so you’re not course-correcting later.
Try prompts like:
- “Load sheet ‘Raw’. Cast OrderDate to ISO date. Left‑join ‘Accounts’ on AccountID. Produce a pivot of MRR by cohort month.”
- “Add a checks section: show row counts before/after joins, null summaries, and any dropped records.”
- “Lock in repeatability: export cleaned_sales.csv and include the script as analysis.md.”
- “Chart nudge: use a log y‑axis and label the top five categories.”
What to watch while it works
- Size limits: Giant files may need chunking or a warehouse handoff. Remember the chat context ceiling for the analysis tool.
- Privacy:
Work runs in a sandboxed environment. Still—follow your org’s data policies and keep PII rules in place. Monitor the session and stop it if you see unexpected access.
- Cost predictability:
With an Anthropic Console account, Claude Code consumes API tokens at standard API pricing.
Treat it like scheduled ETL—batch runs, cache intermediate outputs, keep prompts deterministic.

A fast start for the “AI person” at work
Drop in last quarter’s exports and say:
“Plan the analysis before running code. List steps, then execute. Deliver: 1) anomaly report, 2) cohort table as CSV, 3) two charts (PNG), 4) a reproducible script file.”
You’ll get something you can hand to your manager—or reuse next month with fresh data.
Where teams put it to work
- Finance:
Upload monthly financial data and have Claude produce a dashboard that highlights trends and supports decisions.
- Marketing: Combine funnel touchpoints and surface conversion drop‑offs (with charts you can paste into a deck).
- Sales: Pull global sales, spot territory anomalies, and export a clean table for the CRM import.
A small confession, then a promise
Yes, you’ll still check the output. You should. But once you’ve got a script and a checks section, the redo is minutes, not hours. That’s the quiet win here—clarity over copy‑paste. Less scrolling. More answers.
Ready to transform your spreadsheet workflow?
Start exploring Claude’s file creation capabilities today. Whether you’re dealing with financial models, marketing data, or sales analytics, Claude can help you move from chaos to clarity.